GuideCrops
Replacing the nutrients your harvest removed
Every load of grain, seed or hay that leaves the farm carries nitrogen, phosphorus and potassium with it. Here is how to work out what your crop took off the land, why it matters and how to use the figure alongside a soil test.
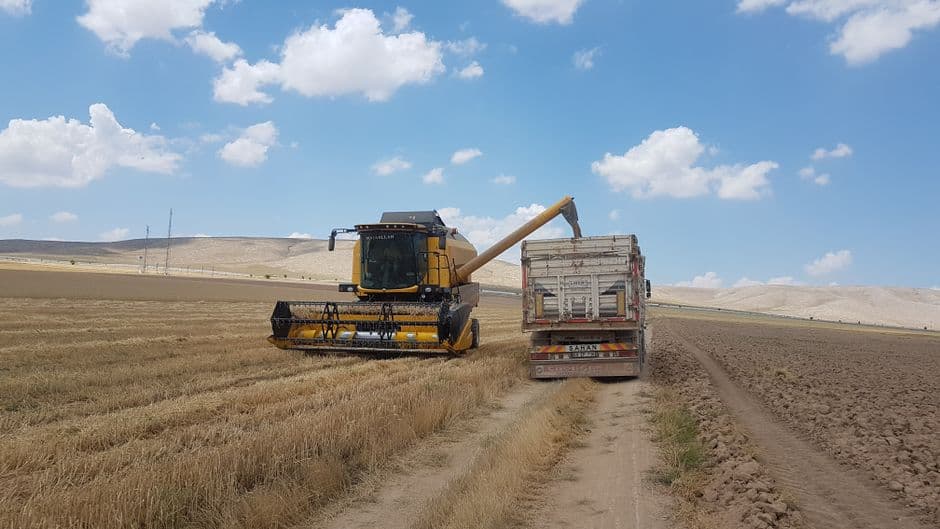
When a truck of maize leaves the farm, it is not only grain that is sold. Locked inside every kernel is nitrogen, phosphorus, potassium and a long list of other nutrients that came out of your soil. Over one season the amount is easy to overlook. Over ten seasons of good yields with too little fertiliser, it adds up to a soil that has quietly been mined, and yields that slip for no obvious reason.
Knowing roughly what each harvest removed gives you a simple, honest baseline: the minimum you would need to put back just to stand still. It is not the whole story of fertiliser planning, but it is a good place to start.
Removal is not the same as uptake
A growing crop takes up far more nutrients than it carries off. Much of the potassium and a good share of the nitrogen sit in the stalks, leaves and roots. If those residues stay on the land, most of what they hold returns to the soil as they break down. What is permanently gone is what leaves in the harvested product: the grain, seed, tubers or bales.
That is why whole-plant crops such as silage and hay take off so much more than grain. When the stalks and leaves are carted away too, nothing is left behind to recycle. A farmer who bales maize residue for winter feed is also removing a large part of the potassium the crop took up, and should budget for it.
Working it out
The sum is short: yield in tons per hectare multiplied by the kilograms of each nutrient in a ton of the harvested product. Multiply by the area and you have the total for the land.
| Crop | kg N per ton | kg P per ton | kg K per ton |
|---|---|---|---|
| Maize grain | 15 | 3 | 4 |
| Wheat grain | 20 | 3.5 | 4.5 |
| Soybean seed | 60 | 5.5 | 18 |
| Potatoes (fresh tubers) | 3.5 | 0.6 | 5.5 |
| Lucerne hay | 28 | 2.5 | 22 |
Take a maize crop of 6 t/ha. At 15 kg N, 3 kg P and 4 kg K per ton, it removed about 90 kg N, 18 kg P and 24 kg K from every hectare. On 100 ha that is 9 tons of nitrogen, nearly 2 tons of phosphorus and 2.4 tons of potassium that went to the silo.
Why the figures vary
Published removal tables are averages. On soil rich in potassium, crops often take up more than they need, and hay or silage from those lands carries more of it away. A drought-stressed crop may have more protein, and therefore more nitrogen, per ton. Varieties differ, and so does moisture at harvest. Treat the typical figures as a sound starting point, not a precise measurement.
If you sell to a buyer who tests protein, or you can send a grain or forage sample to a laboratory, use those results. Protein content can be turned into nitrogen, and a full plant analysis gives P and K directly. The calculator lets you type in your own figures for exactly this reason.
Legumes are different for nitrogen
Soybean, dry beans, groundnuts and lucerne carry a lot of nitrogen in their seed or hay, but most of it did not come from your soil. Working with rhizobium bacteria in their root nodules, legumes fix nitrogen from the air. A well-nodulated legume crop removes large amounts of N on paper without drawing the soil down to match.
So for legumes, look at the phosphorus and potassium figures when you plan replacement, and do not try to put back the nitrogen tonnage. Do check that the plants actually nodulated: split a few roots at flowering and look for pink to red nodules inside. Poor nodulation, from missing inoculant, acid soil or a new land that has never carried that crop, means the plant took more nitrogen from the soil than usual.
Putting a rand value on it
Multiplying each nutrient removed by its price per kilogram turns the harvest into a fertiliser bill. To get a price per kilogram of nutrient, divide the price of a ton of product by ten times its nutrient percentage. Urea is 46% N, so a ton holds 460 kg of nitrogen, and the price per ton divided by 460 is what each kilogram of N costs you.
The value is useful in two ways. It shows what a year of under-fertilising really saved, which is often less than it felt at the time. And when comparing crops for a rotation, it reminds you that a high-yielding crop, or one sold as whole-plant silage or hay, also comes with a higher replacement cost.
Using removal figures well
- Start with a recent soil analysis. On soils low in phosphorus or potassium you need to build up reserves, not only replace what left. On soils well above the sufficiency level you may safely apply less than removal for a season or two.
- Keep a running balance per land: what went on as fertiliser and manure, minus what left in the harvest. A balance that stays negative year after year is a warning, even if yields still look fine.
- Remember that nitrogen is not banked in the soil like phosphorus and potassium. Losses through leaching and to the air mean nitrogen for the next crop is planned from that crop's target yield, not from last season's removal.
- Count manure, compost and crop residues. Kraal manure and residues returned to the land put back a real share of what was removed.
- Check the pH. Acid soil locks up phosphorus and hurts legume nodulation; lime may be a better first spend than extra fertiliser.
A removal figure will not tell you exactly what to apply next season. What it gives you is a clear view of what your farm exported, in kilograms and in rand. Set that next to your soil test and your yield goals, and your fertiliser decisions rest on something firmer than habit.
This guide gives general information. Conditions differ from farm to farm, so confirm recommendations with your local extension officer, agronomist or veterinarian, and always follow the registered product label.